Article type
Year
Abstract
Background:
Trial sequential analysis (TSA) has been proposed as a method to assess whether the results of meta-analyses (MAs) areconclusive. However, as in individual randomized controlled trials, estimation is an issue following TSA since the standard confidence intervals are biased by the monitoring procedure.Objectives:
To compare methods for confidence interval estimation following the application of TSA. We use data from MAs in multiple myeloma to compare the confidence interval estimates of the drift parameter (i.e. expected cumulative z-score) under three spending functions.Methods:
Confidence interval estimation was performed under the frequentist (Pocock and O’Brien-Fleming) and Bayesian sequential procedures. In the Bayesian setting, for the credible interval estimation the control of the type I error was achieved using the ‘handicap’ function, which introduced the degree of skepticism into the interpretation of the meta-analytic results. The estimates were compared using 11 systematic reviews (23 MAs) of treatments for multiple myeloma.Results:
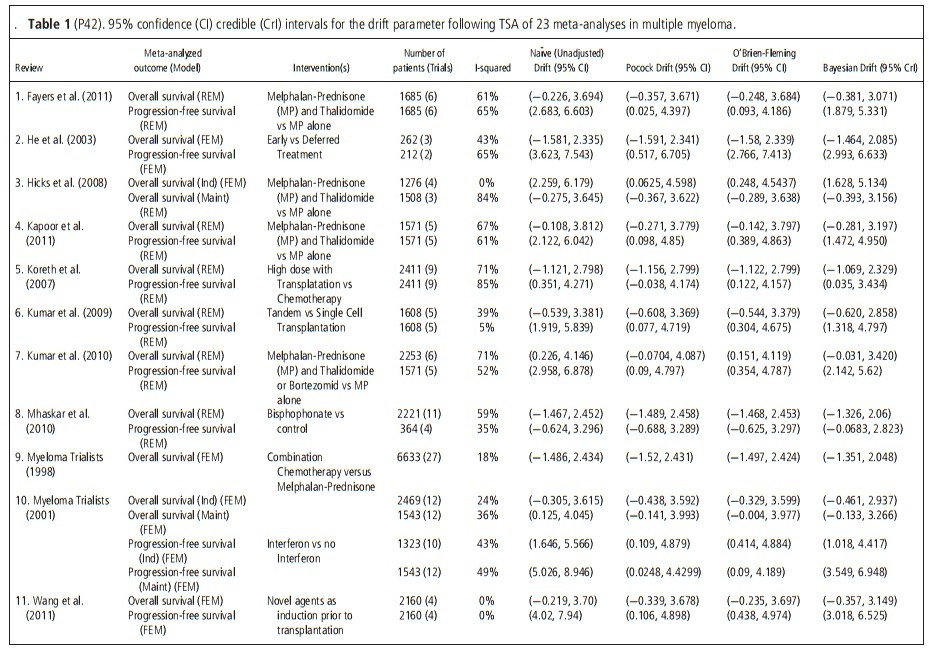
Twenty three separate MAs (13 included overall survival and 10 progression-free survival as outcome) were extracted and confidence/credible intervals calculated (Table 1). The median number of patients per MA was 1608 (range 212–6633) and the median number of trials per MA was 6 (range 2–27). The Bayesian credible intervals of the drift parameter were narrower than either the unadjusted or other group sequential confidence intervals. They also provided for the largest shrink towards the null hypothesis of no treatment effect. The Bayesian sequential boundary was between the O’Brien-Fleming and Pocock boundaries and it approached the O’Brien-Fleming boundary with the increase in the number of trials.Conclusions:
The results demonstrate that the Bayesian credible intervals are narrower than either the unadjusted or adjusted (Pocock and O’Brien-Fleming) sequential intervals.Images